Color-Emotion Associations for Information Visualization
Our lab has begun to investigate affective visualization design, which focuses on designing data visualizations that communicate and influence emotions. Color-emotion links are largely driven by lightness and chroma. For example, positive colors are light and high in chroma, and negative colors are dark and low in chroma.
The strong link between lightness and emotion has interesting implications for visualization design. For visualizations of categorical data (e.g., bar charts), in which data magnitude is encoded using spatial channels (e.g., position, length) and categories are encoded using color, colors of similar lightness (e.g., using all light colors to show positive data) may signal strong affective connotation without harming the observer’s ability to find key patterns in the data. However, this approach poses a problem for visualizations that use color to represent spatial patterns in data (e.g., colormap data visualizations) because lightness contrast is needed to reveal fine details in spatial structure.
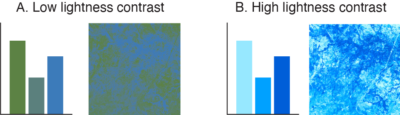
Since lightness is a large factor in determining affective connotation, an issue then arises for colormap data visualization design: Is it possible to produce colormap data visualizations with strong lightness contrast that also have systematic affective connotation?
In a recent study, we found it is possible to design colormaps that have strong lightness contrast to support spatial vision while communicating clear affective connotation. We also found that affective connotation depended not only on the color scales used to construct the colormaps, but also the frequency with which colors appeared in the map, as determined by the underlying dataset. These results emphasize the importance of data-aware design, which accounts for not only the design features that encode data (e.g., colors, shapes, textures), but also how those design features are instantiated in a visualization, given the properties of the data.