
 Our paper on how on how people interpret colormap data visualizations was recently published in IEEE Transactions on Visualization and Computer Graphics (TVCG) and presented at InfoVis 2018.
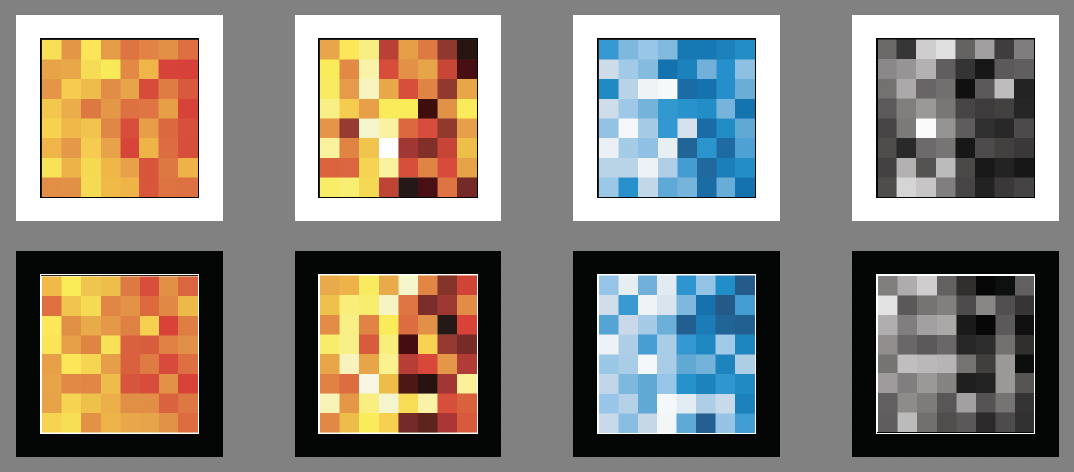
We found that people are better at interpreting colormaps when darker colors map to larger quantities (dark-is-more bias), regardless of the background color, when colormaps do not appear to vary in opacity. Yet, when colormaps do appear to vary in opacity there is evidence for an opaque-is-more bias. These two biases work together on light backgrounds but conflict on dark backgrounds.