
Our paper, “Texture semantics is robust to scaling,” was published in 2025 IEEE Visualization and Visual Analytics (VIS).
AUthors: Zoe S. Howard and Karen B. Schloss
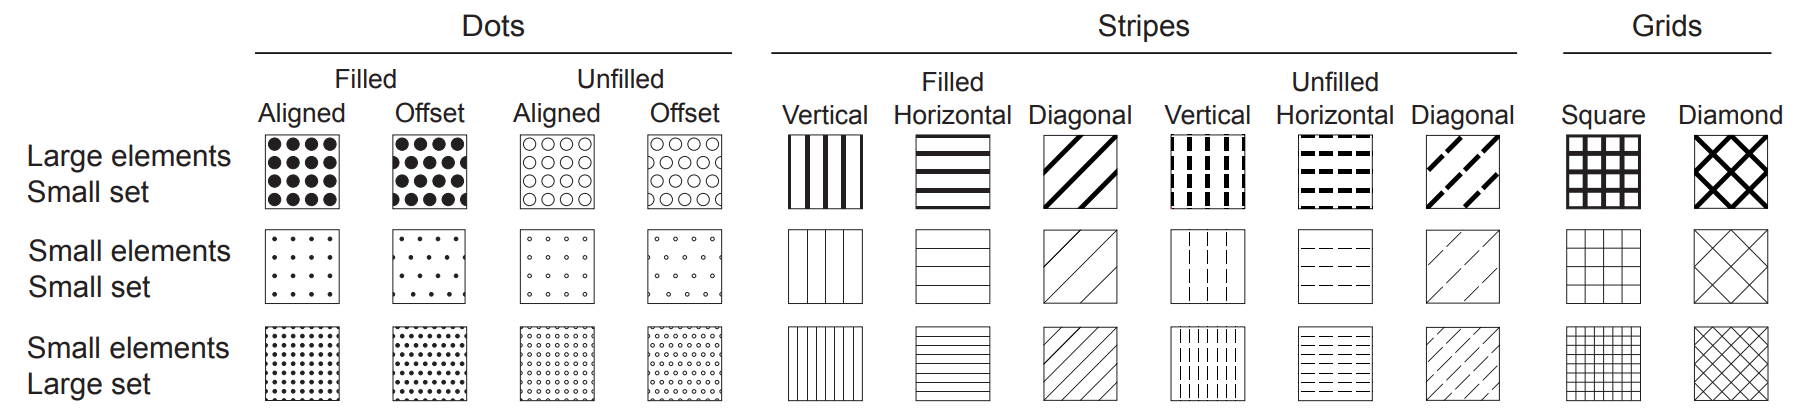 Studies of visual semantics for information visualization aim to understand observers’ expectations about the meaning of visual features (e.g., color, texture) because visualizations that align with those expectations are easier to interpret. Previous work on visual semantics focused primarily on color, with the implicit assumption that color semantics is unaffected by changes in the size of the visualization (given sufficient perceptual discriminability across sizes). Changing size from small scale (e.g., small figures in a paper) to large scale (e.g., large figures in a slide presentation) is straightforward for visualizations that have solid colored regions, but can be more complicated for visualizations with heterogeneous textures because there are multiple ways to scale textures—zooming or repeating texture elements. Previous work suggested that original textures were more perceptually similar to repeat-scaled rather than zoom-scaled textures. Here, we found that texture semantics was preserved after both types of enlargement, suggesting that texture semantics is robust to scaling, at least for geometric textures in which elements are visible at all scales.
Reference: Howard, Z. S. & Schloss, K. B. (2025). Texture semantics is robust to scaling. 2025 IEEE Visualization and Visual Analytics (VIS). PDF
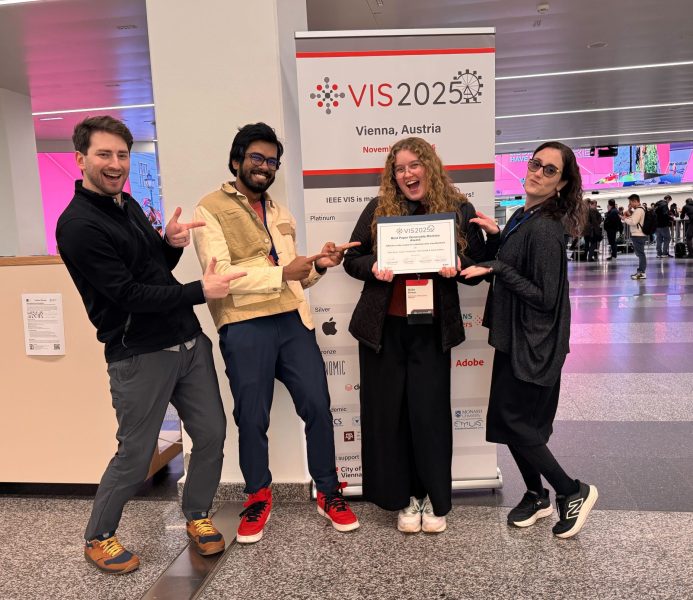 Our paper “Affective color scales for colormap data visualizations” received Honorable Mention for Best Paper at IEEE VIS 2025!
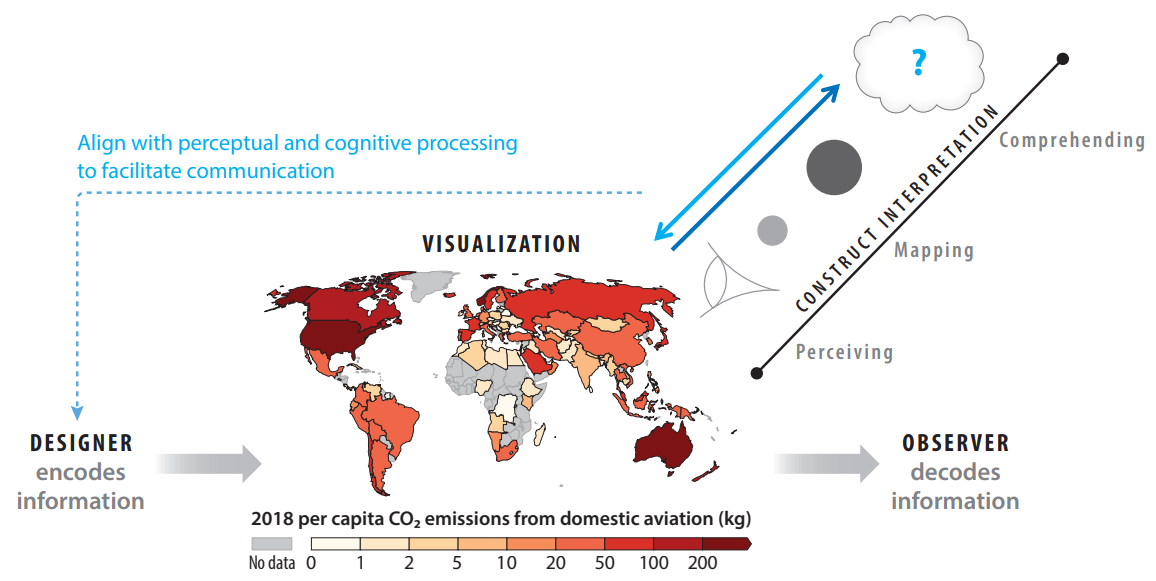 Information visualization is central to how humans communicate. Designers produce visualizations to represent information about the world, and observers construct interpretations based on the visual input as well as their heuristics, biases, prior knowledge, and beliefs. Several layers of processing go into the design and interpretation of visualizations. This review focuses on processes that observers use for interpretation: perceiving visual features and their interrelations, mapping those visual features onto the concepts they represent, and comprehending information about the world based on observations from visualizations. Observers are more effective at interpreting visualizations when the design is well-aligned with the way their perceptual and cognitive systems naturally construct interpretations. By understanding how these systems work, it is possible to design visualizations that play to their strengths and thereby facilitate visual communication.
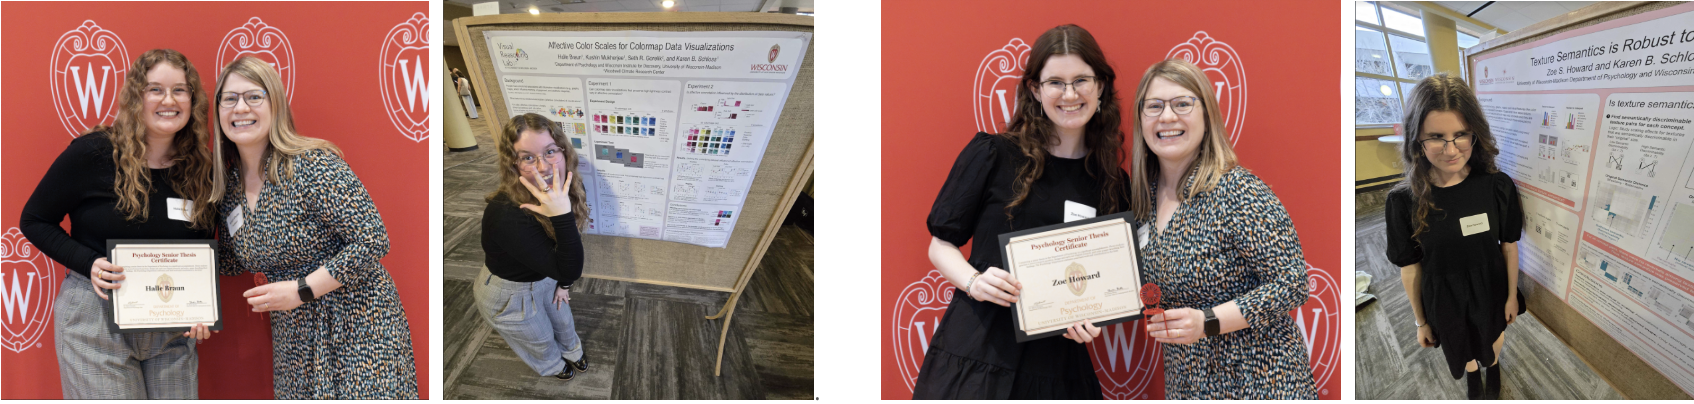
 Dr. Kushin Mukherjee defended his dissertation on Cognitive Abstractions for Visual Communication, and now he is off to a postdoc at Stanford University! Congratulations Kushin, you did outstanding work at UW-Madison and we can’t wait to see where your career takes you!
 Congratulations to Zoe Howard for receiving a 2025 Glushko Outstanding Undergraduate Cognitive Scientist Prize from the Department of Psychology at UW-Madison!
 Congratulations to Nancy Davis (left) for receiving an Outstanding Undergraduate Research Scholar (OURS) Award from the UW-Madison Department of Psychology!
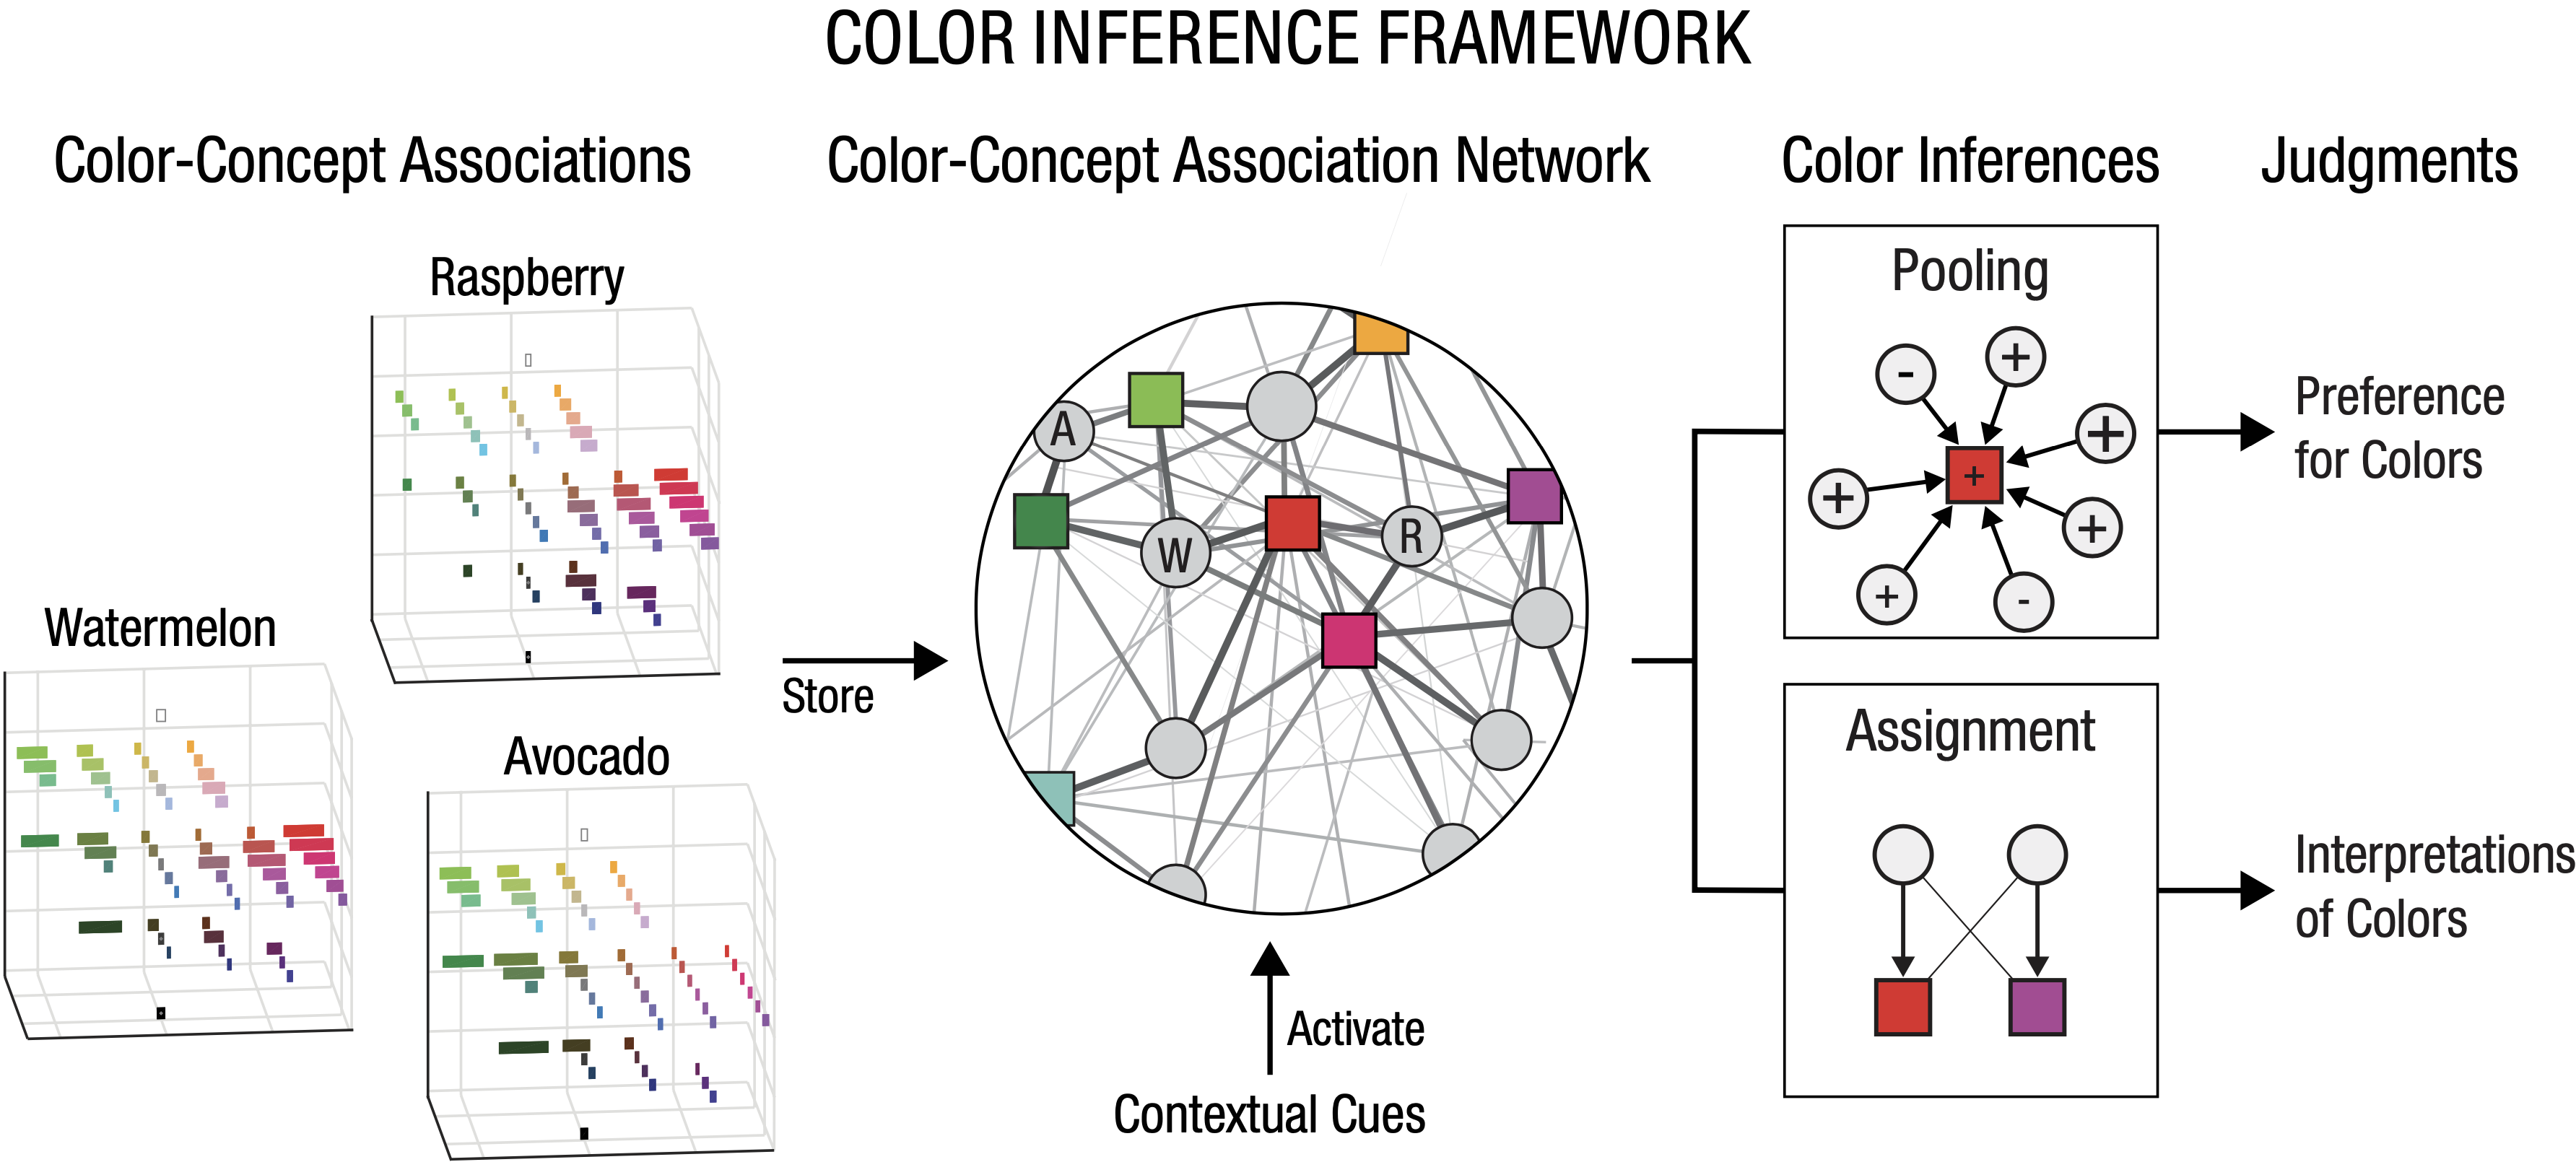
 Dr. Melissa Schoenlein defended her dissertation on Effects of color category structure on learning and generalization of color-concept associations for novel concepts. Now, Melissa is off to start a faculty position in Psychology at High Point University!