Our paper, “Unifying Effects of Direct and Relational Associations for Visual Communication,” was published in IEEE Transactions on Visualization and Computer Graphics.
AUthors: Melissa A. Schoenlein, Jonny Campos, Kevin J. Lande, Laurent Lessard, and Karen B. Schloss
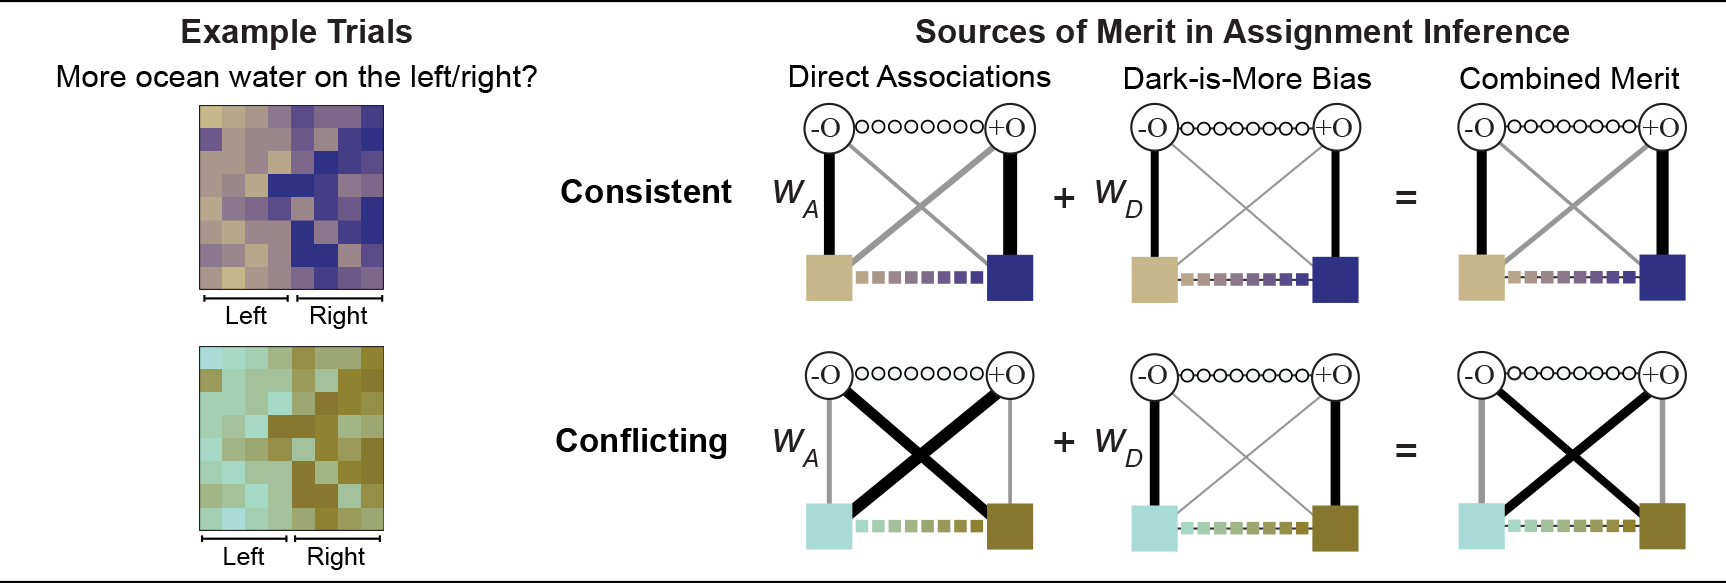 People have expectations about how colors map to concepts in visualizations, and they are better at interpreting visualizations that match their expectations. Traditionally, studies on these expectations (inferred mappings) distinguished distinct factors relevant for visualizations of categorical vs. continuous information. Studies on categorical information focused on direct associations (e.g., mangos are associated with yellows) whereas studies on continuous information focused on relational associations (e.g., darker colors map to larger quantities; dark-is-more bias). We unite these two areas within a single framework of assignment inference. Assignment inference is the process by which people infer mappings between perceptual features and concepts represented in encoding systems. Observers infer globally optimal assignments by maximizing the “merit,” or “goodness,” of each possible assignment. Previous work on assignment inference focused on visualizations of categorical information. We extend this approach to visualizations of continuous data by (a) broadening the notion of merit to include relational associations and (b) developing a method for combining multiple (sometimes conflicting) sources of merit to predict people’s inferred mappings. We developed and tested our model on data from experiments in which participants interpreted colormap data visualizations, representing fictitious data about environmental concepts (sunshine, shade, wild fire, ocean water, glacial ice). We found both direct and relational associations contribute independently to inferred mappings. These results can be used to optimize visualization design to facilitate visual communication
Reference: Schoenlein, M. A., Campos, J., Lande, K. J., Lessard, L., & Schloss, K. B. (2023). Unifying Effects of Direct and Relational Associations for Visual Communication. IEEE Transactions on Visualization and Computer Graphics, 29, 1, 385-395. PDF
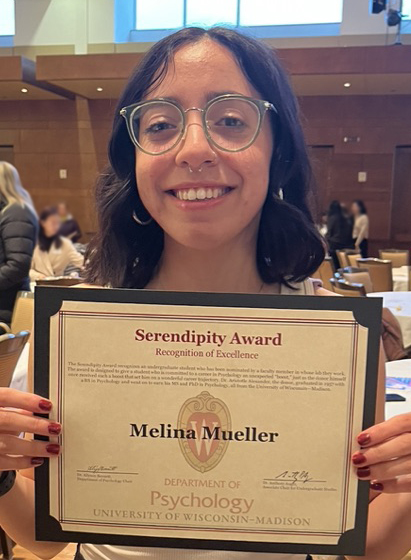 Congratulations to Melina Mueller for receiving the UW-Madison Department of Psychology Serendipity Award! The Serendipity Award, funded by Dr. Aris Alexander, recognizes an undergraduate student who has distinguished themselves through hard work, talent, and dedication, drawing the attention of a faculty member in whose lab they work. Thank you Melina for your strong work on research and service in our lab and beyond!
 Clementine Zimnicki received a 2023 Elsevier/Vision Research Travel Award to present her work at the Annual Meeting of the Vision Sciences Society. Congratulations Clementine!
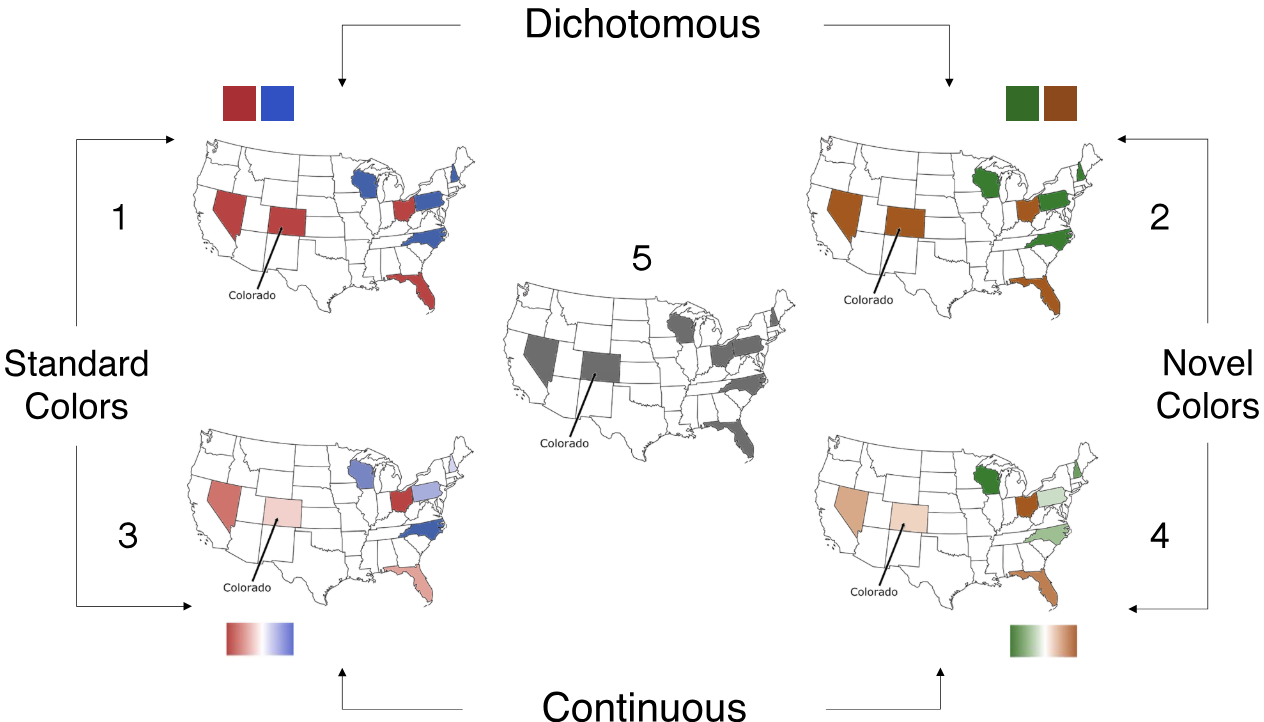 In the United States the color red has come to represent the Republican party, and blue the Democratic party, in maps of voting patterns. Here we test the hypothesis that voting maps dichotomized into red and blue states leads people to overestimate political polarization compared to maps in which states are represented with continuous gradations of color. We also tested whether any polarizing effect is due to partisan semantic associations with red and blue, or if alternative hues produce similar efects. In Study 1, participants estimated the hypothetical voting patterns of eight swing states on maps with dichotomous or continuous red/blue or orange/green color schemes. A continuous gradient mitigated the polarizing efects of red/blue maps on voting predictions. We also found that a novel hue pair, green/orange, decreased perceived polarization. Whether this efect was due to the novelty of the hues or the fact that the hues were not explicitly labeled “Democrat” and “Republican” was unclear. In Study 2, we explicitly assigned green/orange hues to the two parties. Participants viewed electoral maps depicting results from the 2020 presidential election and estimated the voting margins for a subset of states. We replicated the finding that continuous red/blue gradient reduced perceived polarization, but the novel hues did not reduce perceived polarization. Participants also expected their hypothetical vote to matter more when viewing maps with continuous color gradations. We conclude that the dichotomization of electoral maps (not the particular hues) increases perceived voting polarization and reduces a voter’s expected influence on election outcomes.
 PI Karen Schloss has been promoted to Associate professor with tenure!
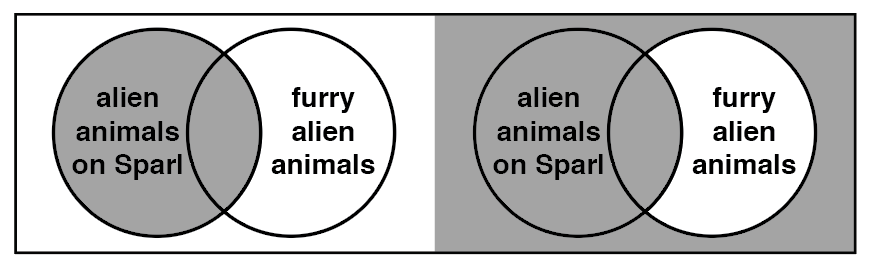 When interpreting the meanings of visual features in information visualizations, observers have expectations about how visual features map onto concepts (“inferred mappings”). In this study we examined whether aspects of inferred mappings, previously identified for other types of visualizations (e.g., colormap data visualizations), generalize to a different type of visualization, Venn diagrams. Venn diagrams offer an interesting test case because empirical evidence about the nature of inferred mappings for colormaps suggests that established conventions for Venn diagrams are counterintuitive. Venn diagrams represent classes using overlapping circles and express logical relationships between those classes by shading out regions to encode the concept of non-existence, or none. We propose that people do not simply expect shading to signify non-existence, but rather they expect regions that appear as holes to signify non-existence (the “hole hypothesis”). The appearance of a hole depends on perceptual properties in the diagram in relation to its background. Across three experiments, results supported the hole hypothesis, underscoring the importance of configural processing for interpreting the meanings of visual features in information visualizations.
 Dr. Anna Bartel graduated with her PhD from the UW-Madison Department of Psychology!