
Overview
To interpret information visualizations, people use visual reasoning to determine how visual features map onto concepts. For example, to interpret the colors in weather maps, in neuroimaging, bar graphs, and recycling bin signs, people must determine which colors in the visualization map on different quantities or categories represented in the visualization. People have expectations, or “inferred mappings” for how visual features will map on concepts, and they have an easier time interpreting visualizations that match those expectations. The challenge is understanding what determines people’s inferred mappings. Addressing this challenge will advance knowledge about how visual reasoning works, and will translate to designing effective and efficient information visualizations.
Highlighted recent work:
Semantic Discriminability for Visual Communication
Karen B. Schloss, Zachary Leggon, and Laurent Lessard
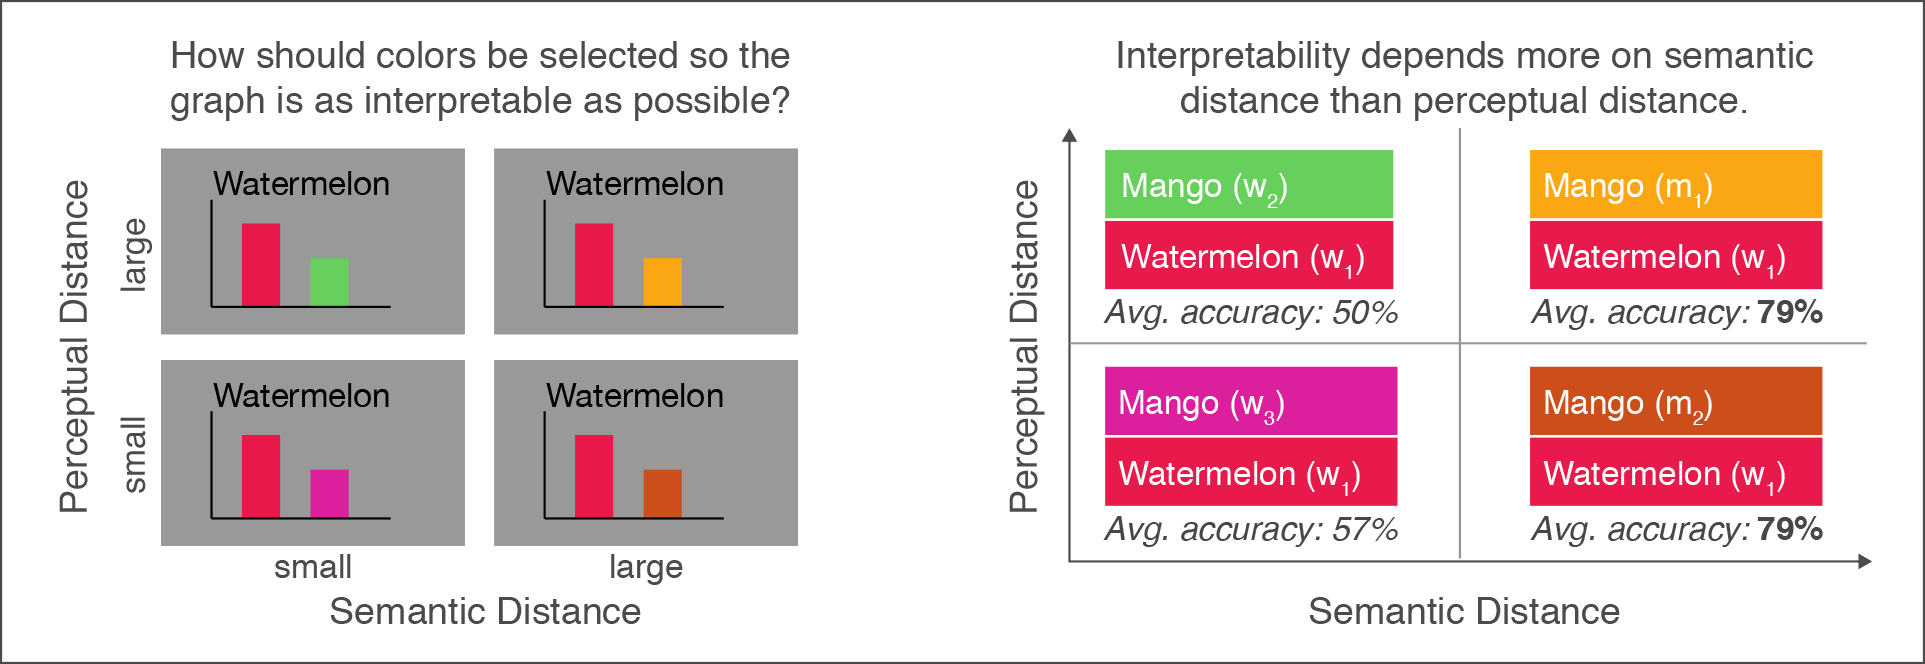
Abstract: To interpret information visualizations, observers must determine how visual features map onto concepts. First and foremost this ability depends on perceptual discriminability; e.g., observers must be able to see the difference between different colors for those colors to communicate different meanings. However, the ability to interpret visualizations also depends on semantic discriminabilty, the degree to which observers can infer a unique mapping between visual features and concepts, based on the visual features and concepts alone (i.e., without legends or labels) discriminability was higher for a color-coding system that maximized semantic distance (maximizing association strength between assigned colors and concepts while minimizing association strength between unassigned colors and concepts), compared with a system that maximized color-concept association strength. However, increasing semantic distance also resulted in increased perceptual distance so it is unclear which factor was responsible for improved performance. In the present study, we conducted two experiments that tested for independent effects of semantic distance and perceptual distance on semantic discriminability of bar graph data visualizations. Perceptual distance was chosen to be large enough to ensure colors were more than just noticeably different. We found that increasing semantic distance improved performance, independent of variation in perceptual distance, and when these two factors were uncorrelated, responses were dominated by semantic distance. These results have implications for navigating trade-offs in color palette design optimization for visual communication.
Reference: Schloss, K. B., Leggon, Z., Lessard, L. (2021). Semantic discriminability for visual communication. IEEE Transactions on Visualization and Computer Graphics, 27, 2, 1022-1031. PDF
Context Matters: A Theory of Semantic Discriminability for Perceptual Encoding Systems
Kushin Mukherjee, Brian Yin, Brianne E. Sherman, Laurent Lessard, and Karen B. Schloss
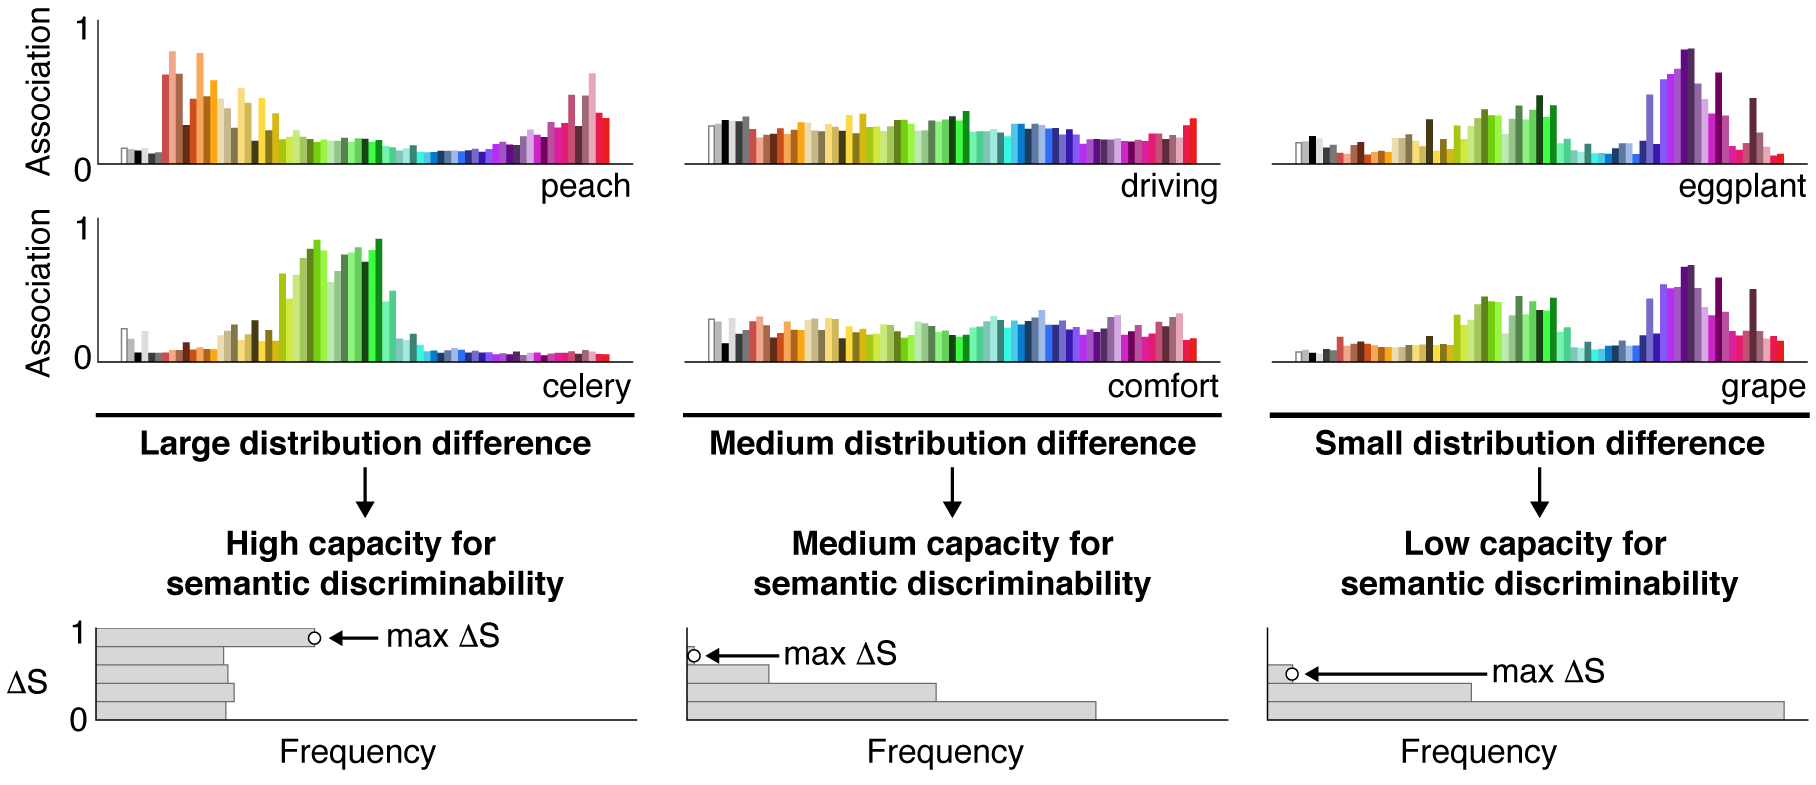
Abstract: People’s associations between colors and concepts influence their ability to interpret the meanings of colors in information visualizations. Previous work has suggested such effects are limited to concepts that have strong, specific associations with colors. However, although a concept may not be strongly associated with any colors, its mapping can be disambiguated in the context of other concepts in an encoding system. We articulate this view in semantic discriminability theory, a general framework for understanding conditions determining when people can infer meaning from perceptual features. Semantic discriminability is the degree to which observers can infer a unique mapping between visual features and concepts. Semantic discriminability theory posits that the capacity for semantic discriminability for a set of concepts is constrained by the difference between the feature-concept association distributions across the concepts in the set. We define formal properties of this theory and test its implications in two experiments. The results show that the capacity to produce semantically discriminable colors for sets of concepts was indeed constrained by the statistical distance between color-concept association distributions (Experiment 1). Moreover, people could interpret meanings of colors in bar graphs insofar as the colors were semantically discriminable, even for concepts previously considered “non-colorable” (Experiment 2). The results suggest that colors are more robust for visual communication than previously thought.
Reference: Mukherjee, K., Yin, B., Sherman, B. E., Lessard, L., & Schloss, K. B., (2022). Context matters: A theory of semantic discriminability for perceptual encoding systems. IEEE Transactions on Visualization and Computer Graphics, 28, 1, 697-706. PDF
Unifying Effects of Direct and Relational Associations for Visual Communication
Melissa A. Schoenlein, Johnny Campos, Kevin J. Lande, Laurent Lessard, and Karen B. Schloss
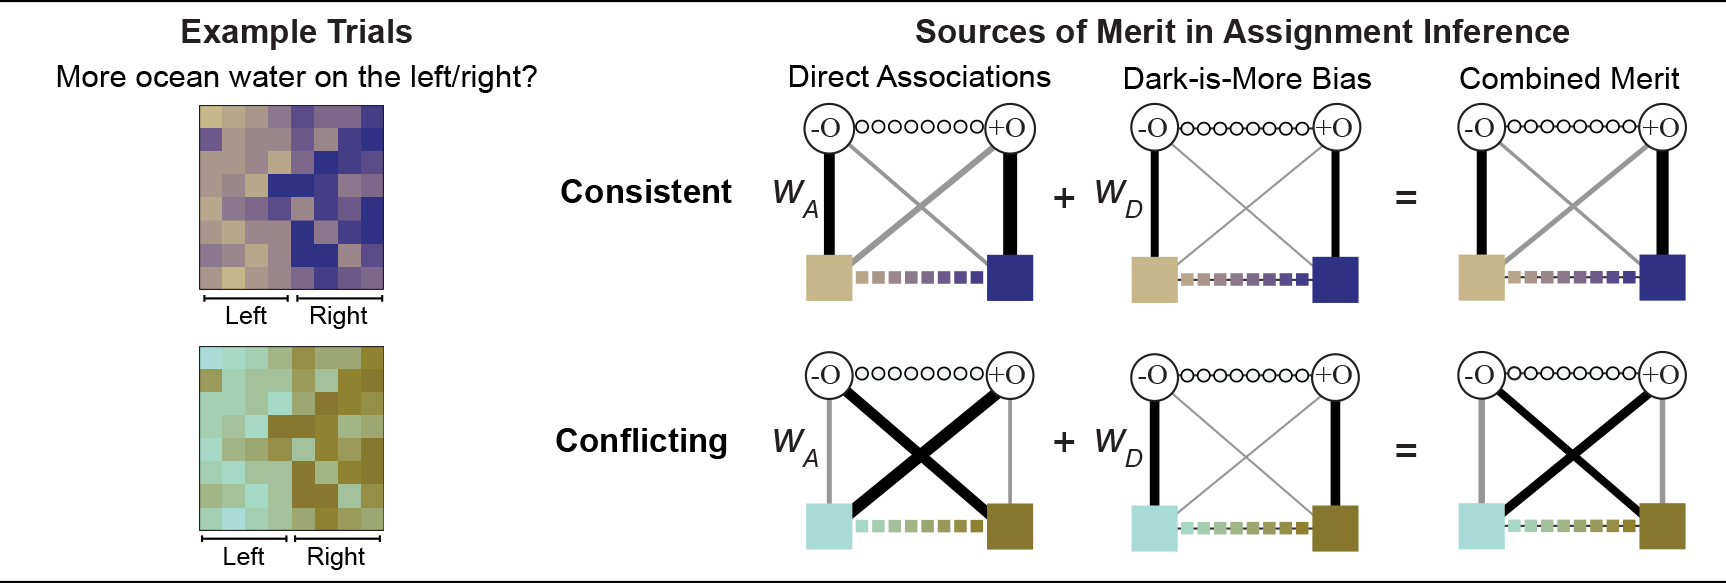
Abstract: People have expectations about how colors map to concepts in visualizations, and they are better at interpreting visualizations that match their expectations. Traditionally, studies on these expectations (inferred mappings) distinguished distinct factors relevant for visualizations of categorical vs. continuous information. Studies on categorical information focused on direct associations (e.g., mangos are associated with yellows) whereas studies on continuous information focused on relational associations (e.g., darker colors map to larger quantities; dark-is-more bias). We unite these two areas within a single framework of assignment inference. Assignment inference is the process by which people infer mappings between perceptual features and concepts represented in encoding systems. Observers infer globally optimal assignments by maximizing the “merit,” or “goodness,” of each possible assignment. Previous work on assignment inference focused on visualizations of categorical information. We extend this approach to visualizations of continuous data by (a) broadening the notion of merit to include relational associations and (b) developing a method for combining multiple (sometimes conflicting) sources of merit to predict people’s inferred mappings. We developed and tested our model on data from experiments in which participants interpreted colormap data visualizations, representing fictitious data about environmental concepts (sunshine, shade, wild fire, ocean water, glacial ice). We found both direct and relational associations contribute independently to inferred mappings. These results can be used to optimize visualization design to facilitate visual communication.
Reference: Schoenlein, M. A., Campos, J., Lande, K. J., Lessard, L., & Schloss, K. B. (2023). Unifying Effects of Direct and Relational Associations for Visual Communication. IEEE Transactions on Visualization and Computer Graphics. PDF